Note
Click here to download the full example code
Loading and understanding Rasters
This is (right now) a dummy example for showing the functionality of geoutils.Raster.
import matplotlib.pyplot as plt

import geoutils as gu
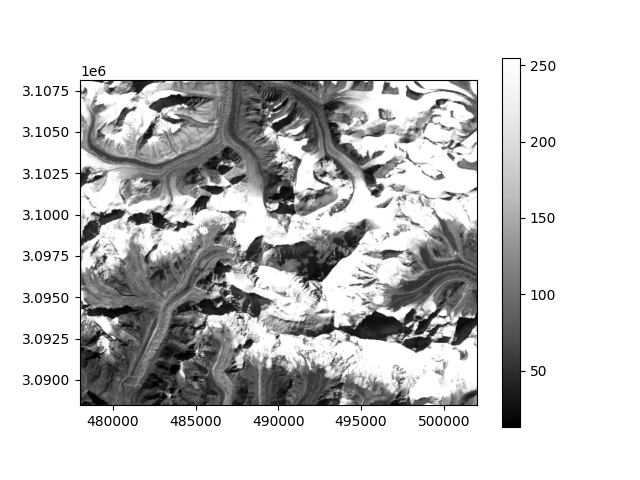
Example raster:
img = gu.Raster(gu.datasets.get_path("landsat_B4"))
Info:
print(img)
Out:
Driver:               GTiff
Opened from file:     /home/docs/checkouts/readthedocs.org/user_builds/geoutils-erikm/envs/docs-backend/lib/python3.7/site-packages/geoutils/datasets/LE71400412000304SGS00_B4_crop.TIF
Filename:             /home/docs/checkouts/readthedocs.org/user_builds/geoutils-erikm/envs/docs-backend/lib/python3.7/site-packages/geoutils/datasets/LE71400412000304SGS00_B4_crop.TIF
Raster modified since disk load?  False
Size:                 800, 655
Number of bands:      1
Data types:           ('uint8',)
Coordinate System:    EPSG:32645
NoData Value:         None
Pixel Size:           30.0, 30.0
Upper Left Corner:    478000.0, 3088490.0
Lower Right Corner:   502000.0, 3108140.0
A plot:
img.show(cmap="Greys_r")
plt.show()
Total running time of the script: ( 0 minutes 0.316 seconds)